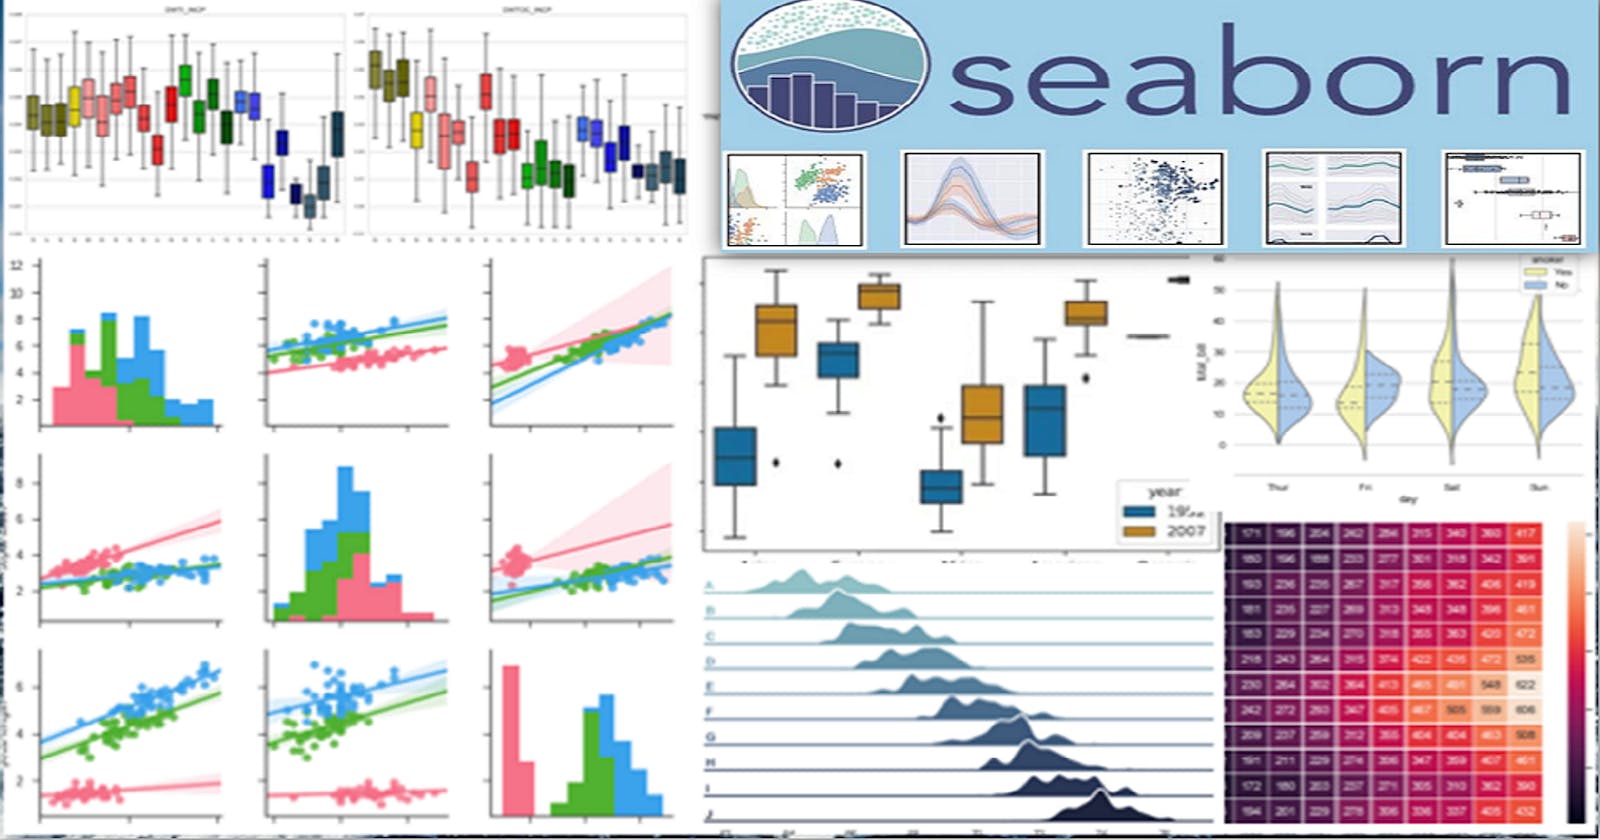
Seaborn is a Python data visualization library builds on top of Matplotlib and integrates closely with Pandas.
Seaborn provides high level interface for drawing more advanced statistical graphics with simple steps.
Seaborn will come inbuilt datasets. We'll see below plots in this blog.
. Distribution Plots:
. Categorical Plots :
. Matrix Plots :
. Grid Plots :
. Regression Plots :
Please refer the below Jupyter Notebook link from my Github repository for detailed explanation for Seaborn Package.
Below is Jupyter Notebook link from my Github repository

If you face any issue while opening the notebook like below
Sorry, something went wrong. Reload? then please click on Reload link. It will be loaded properly.
Reason is when we open any Jupyter notebooks in Github, sometimes above message will be shown due to rich text available in that notebook. Try clicking Reload link multiple times if the issue comes again.

